Impact MetroWest has been an important tool for us as we look for ways to shed new light on the communities we represent, and this week we look in particular at our data surrounding racial equity. The recent 2020 census data provides even more context and speaks to the growing population and diversity of not only the MetroWest communities, but our nation as a whole. Our growing population and diversity provide even more urgency to our examination of racial inequities in our community.
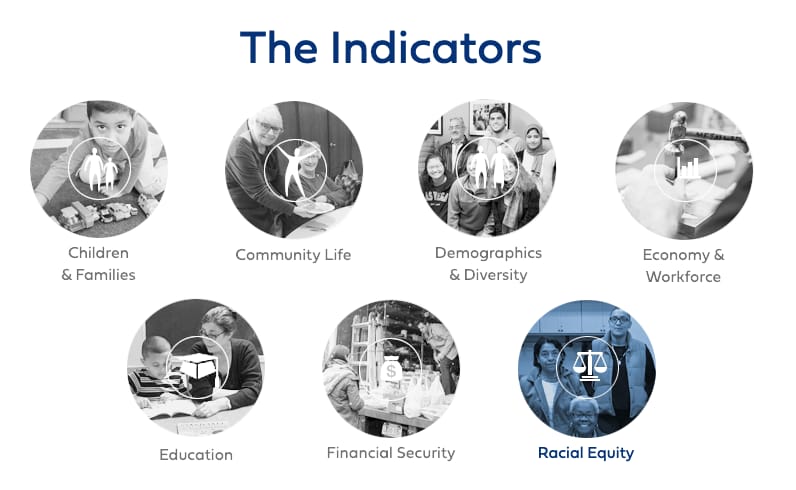
Racial equity has taken center stage as an issue requiring national and local attention. Through Impact MetroWest, we examine a wide range of indicators that highlight racial and ethnic disparities in our population, spanning Health, Education, Economic Security and other areas.
While the racial disparity data exists on a state and national level, it is important to understand how these indicators impact neighbors in the MetroWest region. Each indicator is illuminating and indisputable on its own. I hope you investigate this data, and that it can spark the same curiosity that it does for us here at the Foundation.
Many of these statistics speak to policies and systems, which have had compounding negative effects on people of color throughout generations, include housing policies such as redlining, employment discrimination, unequal access to financial services and capital, education systems that fail to equitably serve all populations, inadequate health care delivery, unjust policies and practices in policing and criminal justice leading to a gap in incarceration rates, and many others that inhibited opportunities for people of color to transfer wealth from generation to generation.

As a result of historic and current policies and systems that have put people of color at a disadvantage, we see large disparities in the indicators included in the racial equity section of Impact MW, which range from rates of infant mortality and adult education levels to poverty and incarceration. In the graph above we see an example of unemployment rate broken down by race, a statistic that speaks to these inequities.
With the release of recent 2020 census information, we have an opportunity to examine how our region has changed over the past decade. This data comes with a huge asterisk – that of the pandemic and all of the known and unknown changes it has wrought. I urge you to keep abreast of recent trends and visit our Impact MetroWest tool as we update our available data.